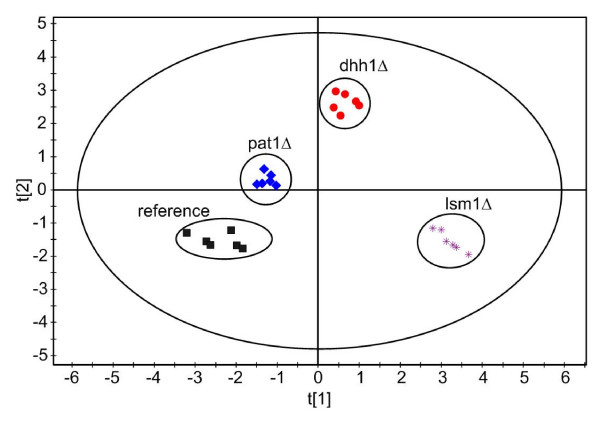
Figure 5.
PCA scores plot based on normalised peak areas from GC/MS analysis of cell extracts and the four strains BY4742 (reference), pat1Δ, dhh1Δ and lsm1Δ (each one n=6). Analysis was conducted using SIMCA-P+ 11.5 (Umetrics, Malmö, Sweden). Data were pareto scaled and the first two components were autofitted.

