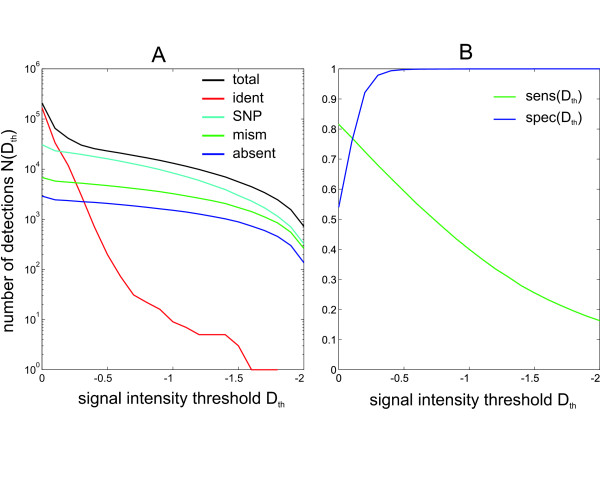
Figure 5.
detection of variations – sensitivity and specificity. Detection of variant oligonucleotides from a comparative hybridization of PA14 and PAO1 DNA. For each strain two independent arrays were used. A) Detection of certain variations by similarity class (Figure 2) for different values of signal ratio threshold Dth. More restrictive (i.e. more negative) threshold values reduce the number of overall detections (total) but false positive detections (ident) are affected more than the others. Each curve represents the number of oligonucleotides that are detected (i.e. that show a signal ratio Di ≤ Dth) using a given Dth. total (black curve) indicates the sum of all detections, while ident (red), SNP (cyan), mismatch (green) and absent (blue) refer to the detection numbers of the respective similarity classes as described in Figure 2. B) Sensitivity and specificity. Sensitivity is defined as the fraction of variant oligonucleotides that are actually detected using a certain threshold Dth (Equation 1). Specificity is defined as the ratio of false positive detections (such of 'identical' oligonucleotides) among all detections (Equation 2). The dashed vertical line indicates a threshold Dth = -0.5 as it is used in the text.

