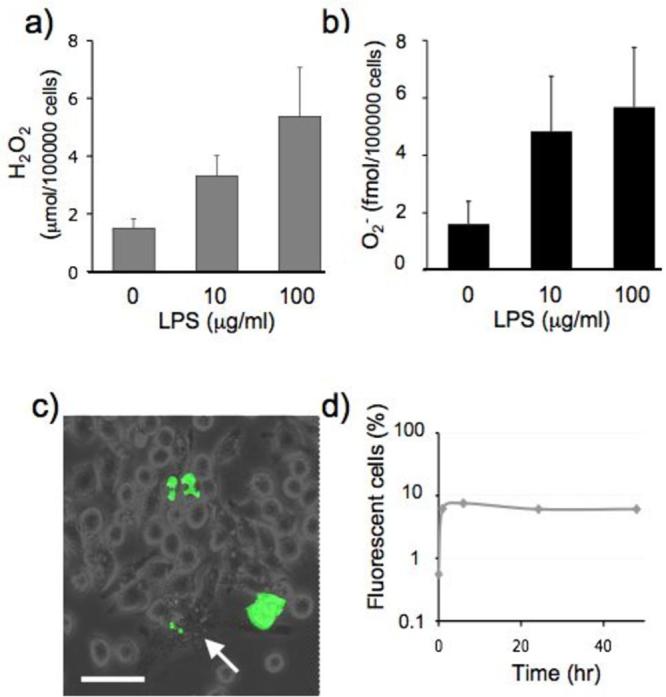
Figure 4. ROS production by activated J774a.1 cells.

J774a.1 macrophage precursor cells were incubated for 48h in medium containing LPS at the indicated concentrations.
(a) H2O2 accumulated in 60 min was determined by microassay based on the peroxidase dependent oxidation of phenol red.
(b) Superoxide (O2−) accumulated in 60 mins was determined by O2− microassay based on the reduction of cytochrome c.
(c) Cells were loaded with the ROS reactive dye CM-H2DCFDA prior to activation with LPS (100μg/ml) and analysed by fluorescent microscopy 24h later. Following LPS activation, macrophages differentiated to produce a varied cell morphology which included a number of large and very granular cells (arrow). Fluorescent staining for ROS reflected this variation in morphology and cells displaying punctated cytoplasmic staining as well as whole cell staining were observed. Scale bar is 50μm. The fraction of ROS positive cells (d) includes all these predominant staining patterns.
