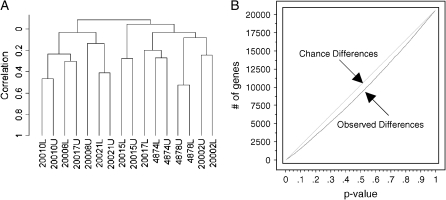
Figure 2.
Regional variability of gene expression in human lungs. Global analysis of gene expression using the 20,669 probe meeting detection and intensity criteria. (A) Dendrogram illustrating the relatedness of all 16 upper/lower paired microarray experiments, based on centered correlation and displayed with average linkage. Six out of the eight individual pairs cluster together, demonstrating that an individual's upper and lower samples are most closely related to each other than to another individual's similar anatomic region. No clustering based on age or sex is observed. (B) Regional variability overabundance graph: upper versus lower lobe (n = 16; paired t test). Overabundance graphs compare the number of genes observed over a range of P value scores (observed discovery, red line) with what would be expected under the matching null hypothesis (chance discovery, green line). The comparison of observed discovery to chance discovery yields a global assessment of true or significant discovery between comparison groups. In this comparison, any differentially expressed genes observed between upper and lower lobes can be explained by chance.

