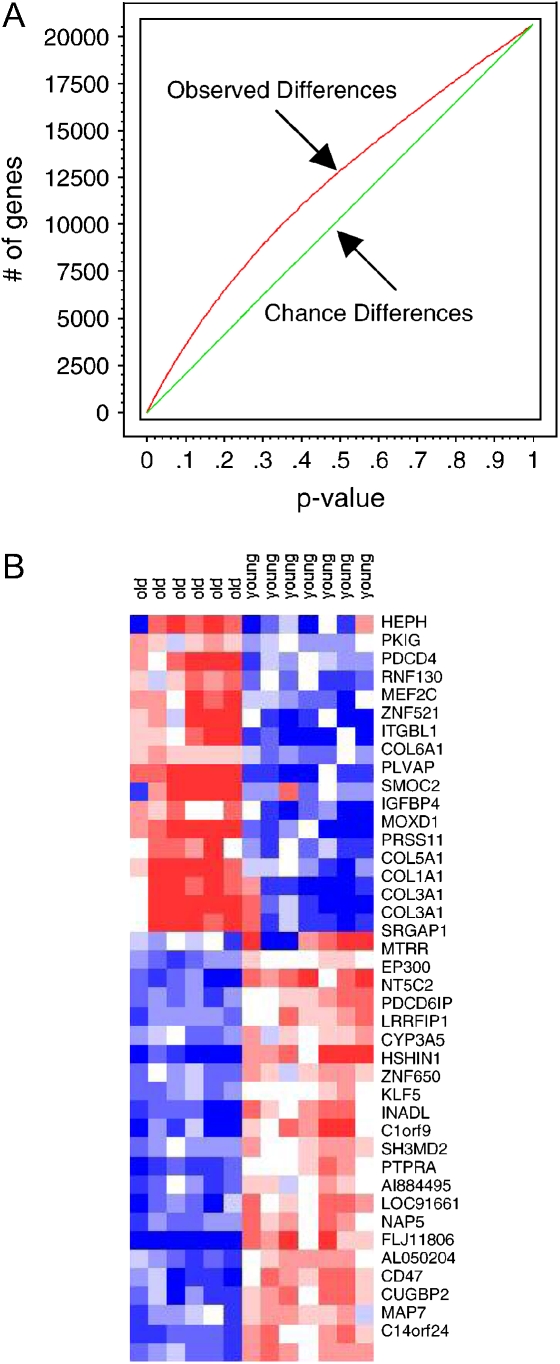
Figure 4.
Age-related variation in gene expression. Lower lobe microarray samples from older subjects (n = 6; age, 68.7 ± 4.3 yr) and younger subjects (n = 7; age, 28.7 ± 7.1 yr) were compared using a two-sample t test. (A) Overabundance graph showing that irrespective of the selected P value threshold chosen, significant numbers of differentially expressed genes can be identified between older and younger subjects. (B) Heat map illustrating the relative expression of 40 genes that meet the threshold of P < 0.001. Blue coloring represents relatively low expression; red coloring represents relatively high expression. Although permutation analysis does not support this gene list as statistically robust (P = 0.086), the overabundance graph supports the conclusion that differential expression exists between the lungs of older and younger individuals.

