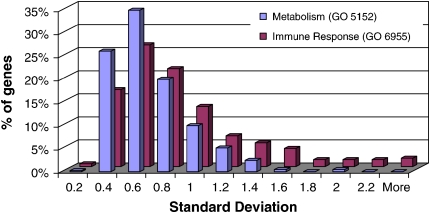
Figure 5.
Distribution of gene expression variability. Histogram showing the distribution of SD values for the 410 probe sets in the GO category “metabolism” (GOID 8,152) and the 330 probesets in the GO category “immune function” (GOID 6,955). Probe sets representing metabolism genes are over-represented in the lowest decile of variability (z-score, 5.2), whereas those representing immune function are over-represented in the highest decile (z-score, 8.6). The distribution of variability between these two GO categories differs significantly (χ2 11.66, P = 0.0006).

