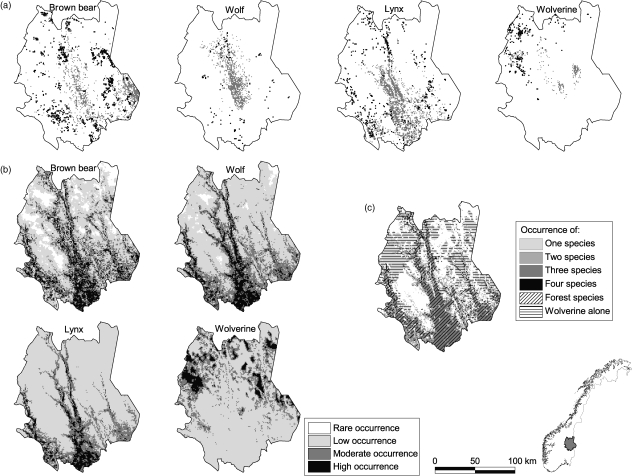
Fig. 1.
(a) Presence maps for four large-carnivore species within the study area in south-eastern Norway (see corner). Presence pixels from radio-tracking data are given in grey; locations of sheep killed by each carnivore species are given as black dots. (b) Occurrence maps for each species; probability distributions were based on species-specific resource selection function models (Fig. 2). (c) Possible sympatry based on the overlap of moderate- and high-occurrence classes for each species.

