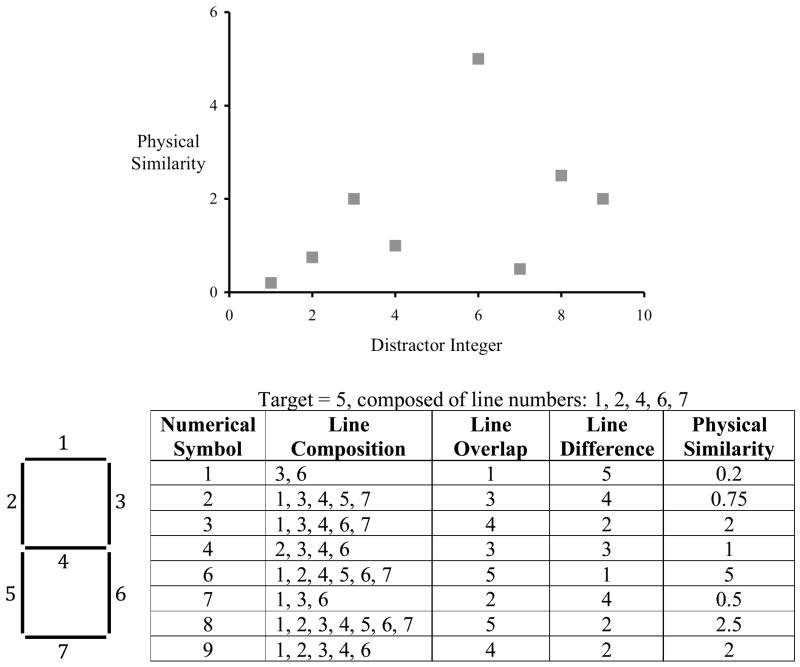
Figure 1.
The calculation of the physical similarity function when the target integer is a 5, and the distractor integers are 1–4 and 6–9. The figure 8 on the left shows the basic structure of the integers, with each line on the figure 8 labeled with a number. The table shows the lines numbers that constitute each integer and the calculation of the similarity function. The figure at the top plots the similarity function.

