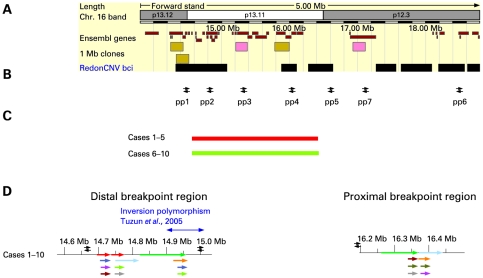
Figure 1.
Molecular overview of recurrent deletions and reciprocal duplications in patients 1–10. (A) ENSEMBL overview (freeze: 24-04-2007) which visualises 1 Mb bacterial artificial chromosome (BAC) clones, the genes involved in the imbalance, the copy number variable regions19 and chromosome bands. (B) The location of real-time quantitative PCR primers used to fine-map the breakpoints, are depicted. (C) The extent of the deletion and duplication is shown by red and green bars, respectively in typical del/dup patients. (D) Organisation of the segmental duplication structure at the distal and proximal breakpoints of recurrent 16p13.1 rearrangements. Each coloured bar represents a pairwise alignment with >98% identity.

