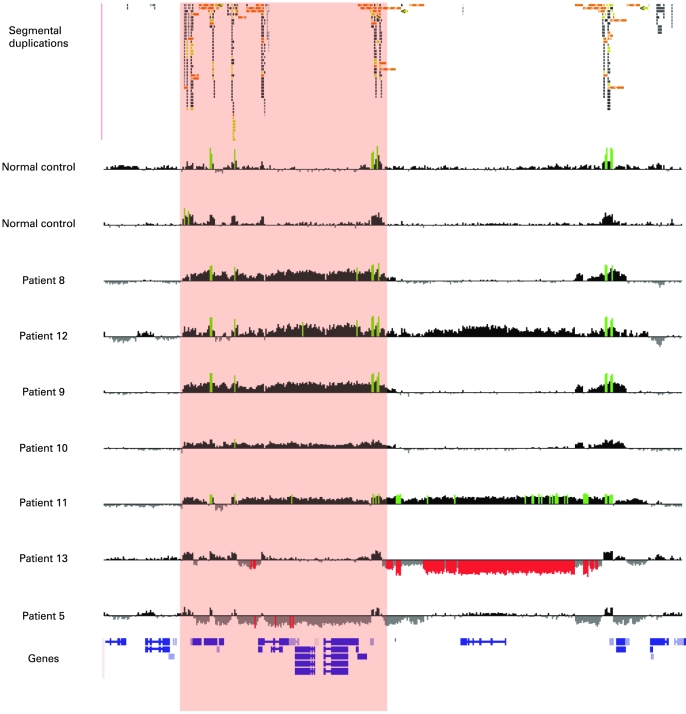
Figure 4.
High-resolution oligonucleotide array mapping of seven 16p12.3–p13.11 rearrangements, of which four have a common distal breakpoint (14.7–14.75 Mb). For those four patients with the common 1.65 Mb rearrangement (red shading), the proximal breakpoints also map to a second LCR16 cluster (16.3–16.77 Mb). Another three patients have an atypical rearrangement: patients 11 and 12 show an atypical larger duplication, with the distal breakpoint between 15.0–15.4 Mb and the proximal breakpoint located within a third LCR16 cluster (18.3–18.4 Mb), and patient 13 has an atypical deletion with proximal breakpoint in the third LCR16 cluster and distal breakpoint in the second cluster. Data from normal control individuals show that there is marked copy number variation in the LCR16 clusters that define these three breakpoint regions. Note that the high degree of homology between these LCR16s also results in false-positive signals from probes that are identical to those within the true deletion/duplication in patients 5, 8 and 9. The image has a 5 Mb region of 16p12–p13 (chr16:14 000 000–19 000 000). For each individual, deviations of probe log2 ratios from zero are depicted by grey/black lines, with those exceeding a threshold of 1.5 SD from the mean probe ratio shown in green and red to represent relative gains and losses, respectively. Segmental duplications of increasing similarity (90–98%, 98–99%, and >99%) are represented by grey/yellow/orange bars, respectively.

