
Figure 3.
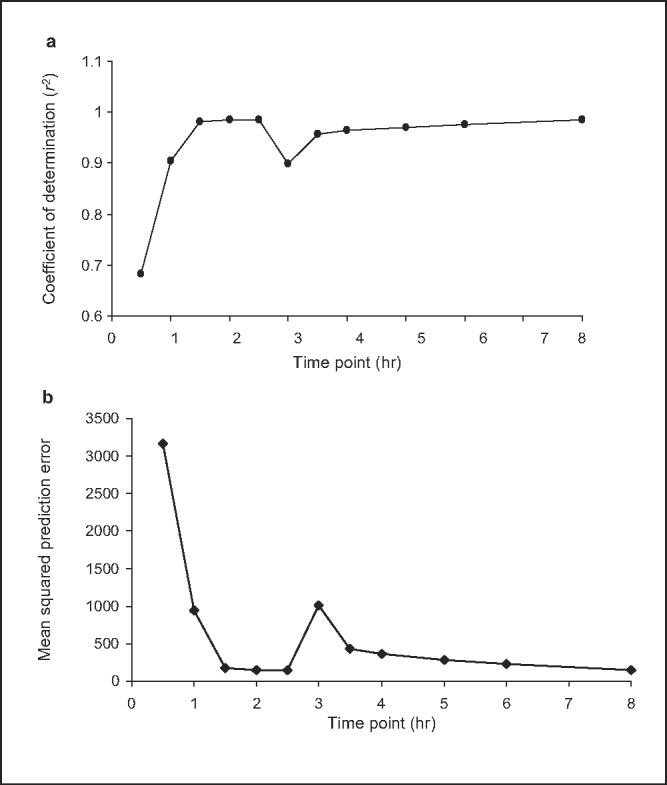
(a) Coefficient of determination (r2) for individual midazolam sampling points and (b) mean squared prediction error (MSPE) for individual midazolam sampling points after 4 weeks of Ginkgo biloba extract administration. Comparison of area under the concentration-time curve from time 0 to infinity (AUC0-∞) and single plasma concentrations for midazolam (0.5-8 hours postdose) when given after 4 weeks of Ginkgo biloba extract administration. Correlations were determined by regression analysis between individual midazolam concentrations and midazolam AUC0-∞. Results are shown for prediction performance, assessed using coefficient of determination (r2) of (a) unweighted regression and (b) MSPE. Optimal sampling time, defined by the best predictive performance, occurs at the maximum r2 and lowest MSPE.