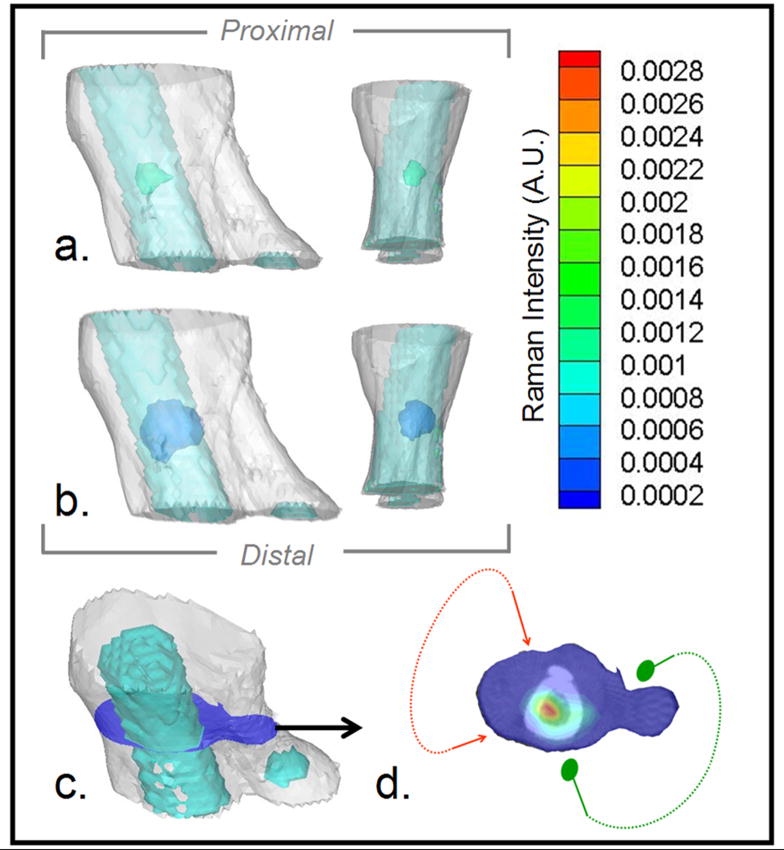
Fig. 2.
Raman tomographic images of canine bone tissue. a) Medial and anterior views of soft tissue mesh (white) and bone surface mesh of tibia and calcaneus (turquoise) overlaid with 50% contrast isosurface of the reconstructed 3-D Raman image of bone (green). b) Same view as (a) overlaid with 10% contrast isosurface of the reconstructed Raman image of bone (blue). c) 3-D mesh of limb section (white), including bone (turquoise), illustrating location of the cross-section (blue) containing the highest Raman scatter intensity. d) Raman intensity at cross-section in (c) in pseudo-color overlaid on the micro-CT image of the bone, showing range of illumination (red arrows) and collection (green dots) positions.

