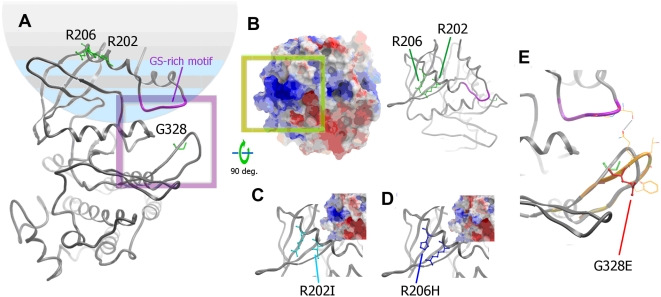
Figure 3. Homology models of ACVR1.
(A) Wild-type ACVR1 kinase domain. The residues where mutations are described in this study are represented as sticks (green, labelled). A ribbons representation of the GS-rich motif is highlighted in magenta. A purple frame marks the zoomed area in panel E. (B) wild-type ACVR1 model rotated 90° around the X-axis to show the surface occluded upon binding of FKBP12 (shown both as ribbons and surface coloured according to electrostatic potential). The green box denotes the positive patch seen in the model of wild-type ACVR1. (C) and (D) mutations Arg202Ile and Arg206His are shown as ribbons, with the mutations indicated (same view as panel B). The predicted electrostatic potential for each mutant protein is shown in the insert (framing is equivalent to the green box of panel B). (E) Mutation Gly328Glu induces a significant conformational change in the loop where it is sited. One of the putative conformations is depicted in orange (wild-type loop conformation shown in grey). In this example a potential direct interaction could be formed between the modelled loop and the GS-rich motif.

