
Figure 4. Summary of fluorescence-activated cell sorting (FACS) analysis.
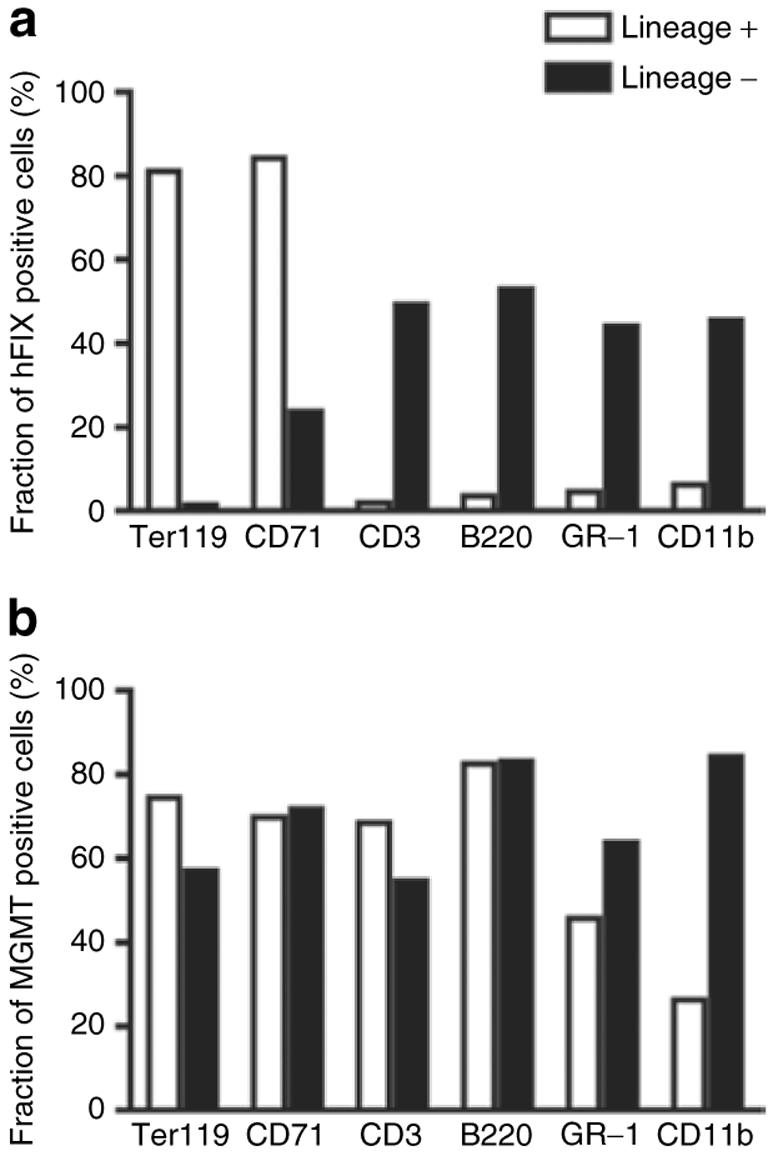
Fractions of (a) human factor IX (hFIX) or (b) methylguanine methyltransferase (MGMT) positive cells in lineage positive or negative cells. Representative data derived from FACS analysis (Figure 3).