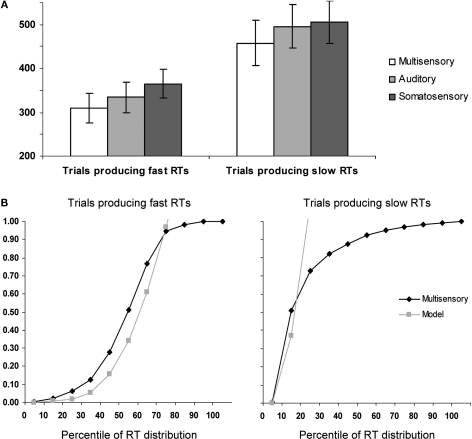
Figure 1.
Behavioral results. (A) Mean reaction times (SEM shown) for auditory–somatosensory multisensory pairs, auditory, and somatosensory stimuli (white, light gray, and dark gray bars, respectively). The left and right panels show data from trials producing faster and slower RTs, respectively. (B) Results of applying Miller's (1982) race model inequality to the cumulative probability distributions of the reaction time data. The model is the arithmetic sum of the cumulative probabilities from auditory and somatosensory trials. The x-axis indicates the percentile of the reaction time distribution after median split of the data. As above, the left and right panels show data from trials producing faster and slower RTs, respectively.

