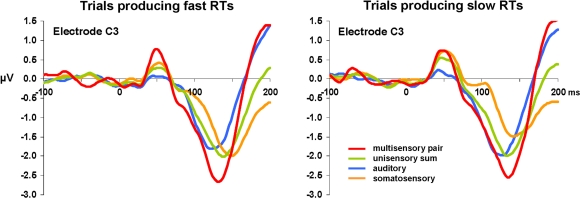
Figure 2.
Group-averaged voltage waveforms. Data are displayed at an exemplar left-lateralized central electrode site (C3) from each condition. Separate graphs depict ERPs from trials producing fast and slow RTs. Non-linear neural response interactions appear to start over the ∼40–80 ms post-stimulus onset for trials leading to fast but not to slow RTs.

