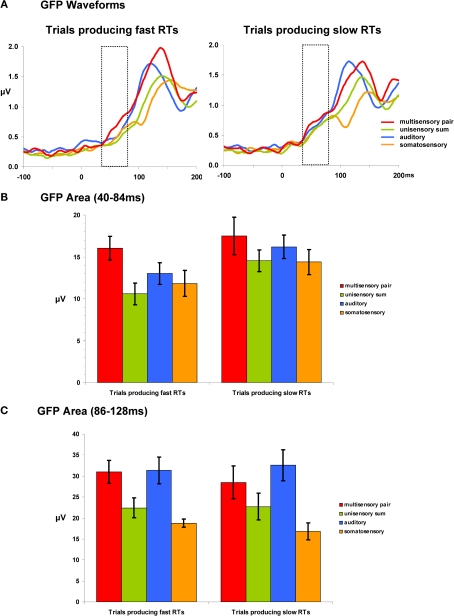
Figure 3.
Global field power (GFP) waveforms and analyses. (A) group-averaged GFP waveforms are displayed for each condition and are also separated according to later RT speed. The dotted insets indicate the 40–84 ms post-stimulus interval over which area measures were calculated. (B) Mean (SEM shown) GFP area measurements over the 40–84 ms post-stimulus interval. (C) Mean (SEM shown) GFP area measurements over the 86–128 ms post-stimulus interval.

