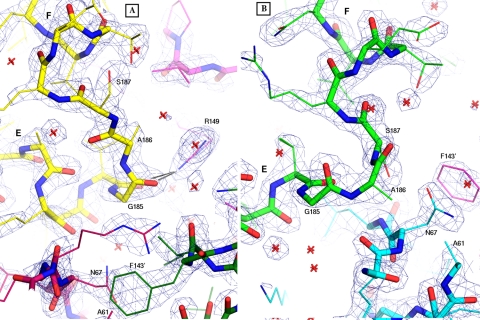
FIGURE 2.
Electron density for the HTH regions, showing the final refined 2Fo – Fc map contoured at 1.8 σ. Helices E and F are labeled in both panels. A, for the A chain, the HTH is colored yellow, the hairpin is dark red, and the hinge region is magenta. The hinge region of the B chain is colored dark green. Black lines show the two H-bonds from Arg-149 to the carbonyls of Val-184 and Gly-185. B, for the B chain, the HTH is colored green, and the hairpin is cyan. The prime symbol is used in each panel to indicate Phe-143 from the other subunit. Note the different conformations of residues 185–187 (labeled) in the HTH turn, the different locations of Asn-67 and Phe-143′, and the involvement of Arg-149 in subunit A only. Water molecules are represented as red stars. Images made using PyMOL (27).

