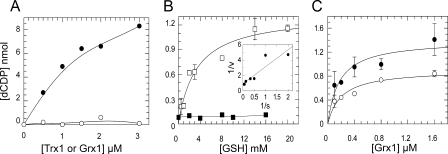
FIGURE 6.
Requirement of GSH for reduction of RNR with Grx. A, assay mixture contained 120 μg/ml R1, 40 μg/ml R2, and 0.4 mm DTT as ultimate reducing power. RNR activity with different concentrations of Trx1 (•) or Grx1 (○) was measured. The background activity of RNR with this amount of DTT was subtracted from each point. B, two series of samples with 74 μg/ml R1 and 36 μg/ml R2, and increasing concentrations of GSH were prepared; the reaction was started by adding reaction mixture supplemented with 1 μm Grx1, 1 mm NADPH, and 0.1 μm GR (□). Each point represents the mean value of two independent experiments with duplicate samples. The inset shows Lineweaver-Burk plot. In the second series (▪) standard reaction mixture was used to detect the background activity with different amounts of GSH. C, enzyme activity of 74 μg/ml R1 and 36 μg/ml R2 versus different concentrations of Grx1 is shown. Utilizing 4 mm (○) or 10 mm (•) GSH plus 1 mm NADPH and 0.1 μm GR were compared.

