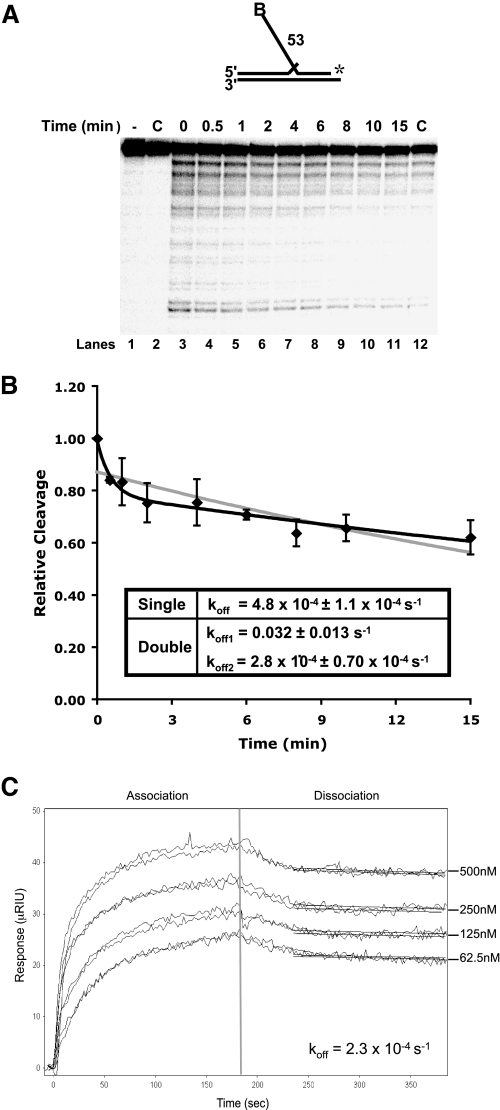
FIGURE 1.
Slow dissociation of Dna2 from DNA substrates. A, Dna2 (200 fmol) and 5 fmol of a radiolabeled 53-nt flap substrate (D4:U2:T2) were incubated followed by the addition of 200-fold excess unlabeled flap substrate (D4:U2:T2). MgCl2 was then added at the indicated time points. Dna2 cleavage was then measured by denaturing PAGE. Lane 1 is the substrate alone. Lane 2 is Dna2 with labeled and unlabeled substrate without MgCl2. In lane 12, the labeled and excess unlabeled substrates were mixed prior to the addition of Dna2. B, graphical analysis of A. Points were fit to a single (gray line) or double (black line) exponential decay curve using nonlinear least squares regression. Cleavage is defined as (cleaved/(cleaved + uncleaved)) × 100 and values were then normalized to cleavage at time zero. For the double exponential decay curve, the dissociation amplitude described by the first curve was 21% and the second 78%. C, surface plasmon resonance was used to measure the affinity between Dna2 and ssDNA (D4). Dna2 was immobilized, and increasing amounts of substrate (62.5, 125, 250, and 500 nm) were flowed over the chip. Measurements at each concentration were repeated twice. After 3 min, the flow of ssDNA was discontinued, and buffer alone was flowed over the chip to measure dissociation.

