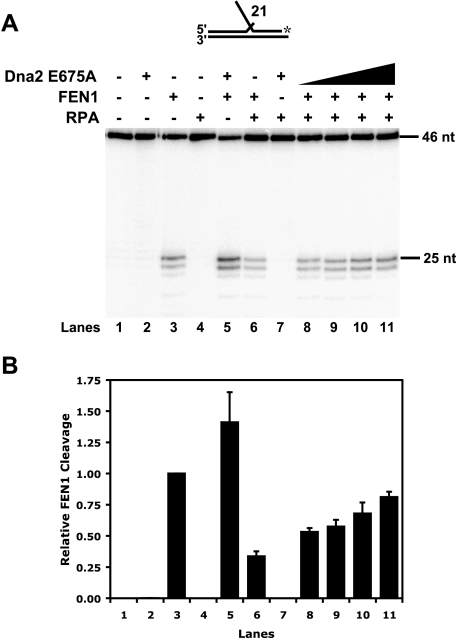
FIGURE 5.
Dna2 E675A overcomes RPA inhibition of FEN1. RPA (200 fmol), FEN1 (0.25 fmol), and Dna2 E675A (10, 20, 100, and 200 fmol) were mixed followed by the addition of a 21-nt flap substrate (D7:U3:T3) (lanes 8–11). Denaturing PAGE was then used to separate the products. Lane 1 is the substrate alone control. Lanes 2–4 are substrate with Dna2 E675A (200 fmol), substrate with FEN1 (0.25 fmol), and substrate with RPA (200 fmol), respectively. Lanes 5–7 are substrate with Dna2 E675A (200 fmol) and FEN1 (0.25 fmol), substrate with RPA (200 fmol) and FEN1 (0.25 fmol), and substrate with Dna2 E675A (200 fmol) and RPA (200 fmol), respectively. B, graphical analysis of A. Each bar of the graph represents the conditions shown in the corresponding lane in A. The bars are an average of four independent experiments, and error bars represent the S.D. The substrate is depicted above the gel in A, and the asterisk indicates the site of the 3′-32P radiolabel.

