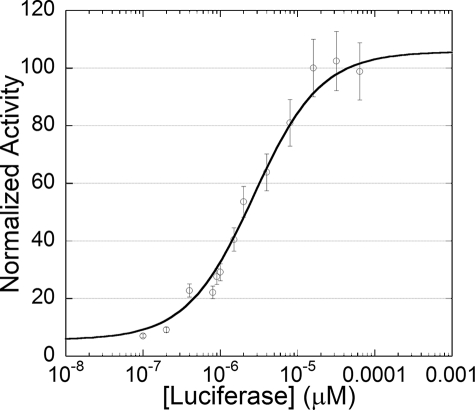
FIGURE 4.
Influence of luciferase concentration on initial light intensity in the coupled reaction with Fre. Assays contained luciferase, 1 μm oxidoreductase, 10 μm decanal, 10 μm NADPH, and 2 μm FMN. Reactions were initiated with the rapid injection of 1.0 ml of buffer. Measurements were recorded once steady state light emission was reached, ∼5 s after injection. Data were fit to the Michaelis-Menten equation as described (50). This plot was generated with kaleidagraph (Synergy Software).

