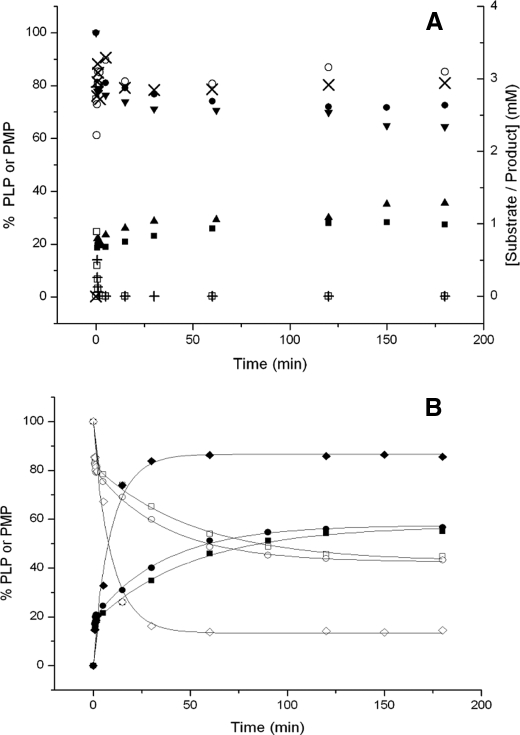
FIGURE 2.
Time course of the overall reaction of AGT-Ma, AGT-Mi, and Phe152 variants. AGT-Ma, AGT-Mi, or Phe152 variants at a concentration of 2.6 μm were incubated at 37 °C in 100 mm potassium phosphate buffer, pH 7.4. At the indicated times, aliquots were withdrawn and denatured. After removal of the precipitated protein by centrifugation, the supernatants were subjected to HPLC analysis as described under “Experimental Procedures.” A: •, PLP; ▪, PMP; □, glyoxylate; ○, pyruvate, for AGT-Ma; ▾, PLP; ▴, PMP; +, glyoxylate; ×, pyruvate, for AGT-Mi. B: □, PLP; ▪, PMP for F152I-Mi; ○, PLP; •, PMP for F152I-Ma; ⋄, PLP; ♦, PMP for F152A-Ma. The percentage of PLP or PMP is referred to the original PLP content of the enzymes. The curves represent the least-squares fit of a second-order rate equation to the data. The data shown are the means of three independent experiments. In each case, the standard error of the mean was less than 5%.

