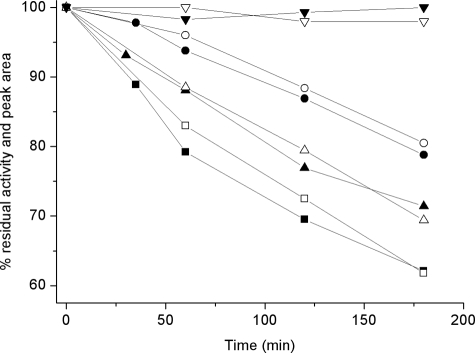
FIGURE 5.
Time-dependent loss of activity and integrated peak area of apoF152i-Mi upon incubation at 37 °C. ApoF152I-Mi was incubated at 1 (circles), 0.5 (up triangles), 0.25 μm (squares) at 37 °C in 100 mm potassium phosphate buffer, pH 7.4. Aliquots were withdrawn at the indicated times and assayed either for transaminase activity or for the integrated peak areas measured upon gel filtration on a size exclusion chromatography. For comparison, the transaminase activity and the integrated peak area of 0.25 μm apoAGT-Mi upon incubation at 37 °C (down triangles) are shown. Closed and open symbols represent percentage of transaminase activity and integrated peak area, respectively. The lines are drawn to guide the eye.

