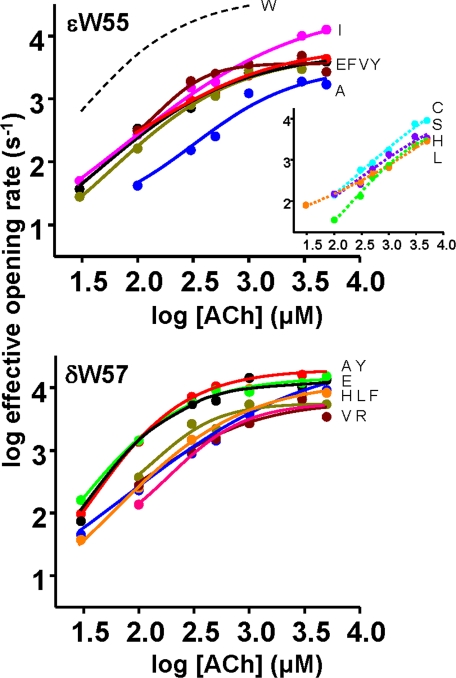
FIGURE 3.
Dose-response curves. The effective opening rate is the inverse of the predominant (and slowest) intra-cluster nonconducting interval component, whose high concentration asymptote is an estimate of the channel opening rate constant. Top, εTrp-55 mutations. W (WT), dashed black line (calculated from the rate constants in Tables 1 and 2); F, black; E, red; A, blue; I, pink; V, gold; Y dark red. Inset, C (cyan), S (purple), H (green), and L (orange) mutants showed insufficient saturation to estimate an asymptote. Bottom, δTrp-57 mutations. F, black; E, red; A, blue; V, gold;Y, dark red; H, green; L, orange; R, dark pink.

