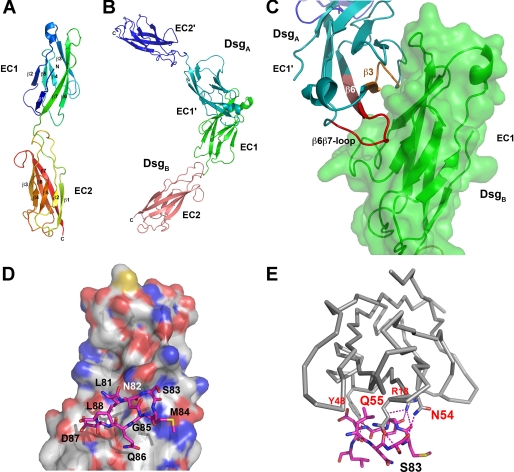
FIGURE 1.
Dsg1 EC1 and EC2 modeling and peptide design. A, secondary structure elements as well as the N and C termini of the Dsg1 EC1 and EC2 model are indicated. B, model of the Dsg1 transinteraction as shaped on the basis of the N-cadherin crystal structure. The two EC1 domains interact via a large interface suggesting an in vivo interaction. C, blow-up of the interface region with peptide fragments possibly interfering with transinteraction shown in orange and red. A similar model was obtained for Dsg3 (data not shown). D, an SP designed to block Dsg transinteraction corresponded to residues Leu-81 to Leu-88 located in the putative binding site on Dsg1, the latter being illustrated by a van der Waals surface representation in atom color code. E, in comparison with D, the putative polar interactions (hydrogen bonds) are shown as stippled lines in magenta. Note that SP formed numerous H-bonds with residues in the Dsg1 binding site.

