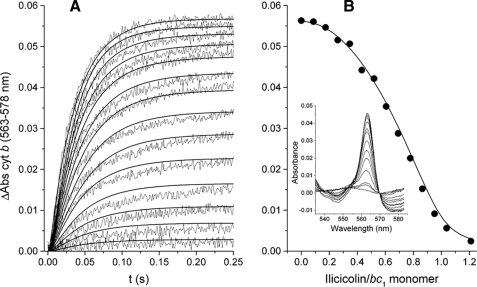
FIGURE 2.
Inhibition of the pre-steady state reduction of cytochrome b (cyt b) through center N by ilicicolin. A shows the reduction traces of 1.5 μm stigmatellin-inhibited cytochrome bc1 complex by 15 μm DBH2 preincubated in the presence of increasing ilicicolin concentrations (from 0 to 1.2 ilicicolin/bc1 monomer in 0.085 intervals). Solid curves correspond to the simulated kinetics at each ilicicolin concentration assuming intermonomeric electron transfer between center N sites at a rate of 500 s-1 (see supplemental data for details). The maximum extent of reduction at each ilicicolin concentration is shown in B (solid circles) taken from the spectra collected at 0.25 s (inset). The solid curve represents the expected extent of cytochrome b reduction assuming that dimers with only one ilicicolin bound contribute to the total absorbance as much as dimers with no ilicicolin. Enzyme-inhibitor complexes were calculated using the equilibration model described in the supplemental data assuming association and dissociation rates for ilicicolin of konI = 1.5 × 10⁵ m-1 s-1 and koffI = 1 × 10⁻³ s-1, respectively.

