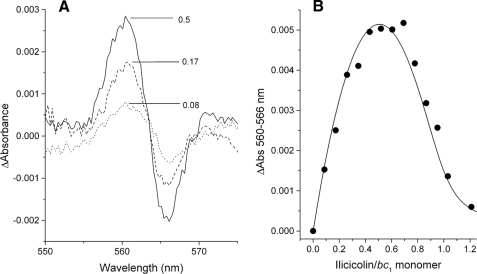
FIGURE 4.
Ilicicolin-induced spectral shift of the reduced bH heme absorbance upon reduction through the uninhibited center N site in the dimer. A shows the difference between the averaged spectra collected between 0.2 and 0.3 s at the indicated ilicicolin/bc1 monomer ratios and the average and normalized spectra collected in the absence of ilicicolin. B shows the maximal amplitude of the spectral shift induced by ilicicolin at different inhibitor/bc1 monomer ratios. The solid curve represents the relative change in concentration of dimers with only one ilicicolin bound at a center N site obtained at different inhibitor/enzyme ratios. Enzyme-inhibitor complexes were calculated using the equilibration model described in the supplemental data assuming association and dissociation rates for ilicicolin of konI = 1.5 × 10⁵ m-1 s-1 and koffI = 1 × 10⁻³ s-1, respectively.

