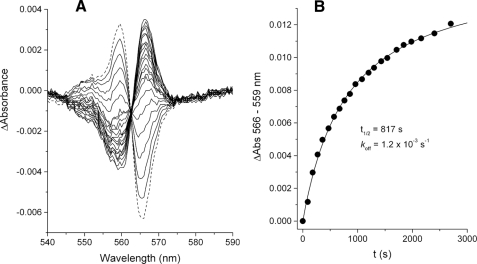
FIGURE 5.
Rate of ilicicolin displacement from center N by antimycin. A shows the spectral shift generated after the addition of 10 μm ilicicolin to 4 μm fully reduced bc1 complex and incubation for 5 min (dashed spectrum). 10 μm antimycin was then added, and subsequent spectra (solid traces) were collected every 2 min, showing the simultaneous loss of the blue shift and appearance of a red shift, which indicate ilicicolin dissociation and antimycin binding, respectively. The time course of the spectral red shift induced by the binding of antimycin is shown in B. The solid curve corresponds to the fitting of the data to a one-exponential function, which yielded the indicated rate constant for ilicicolin dissociation.

