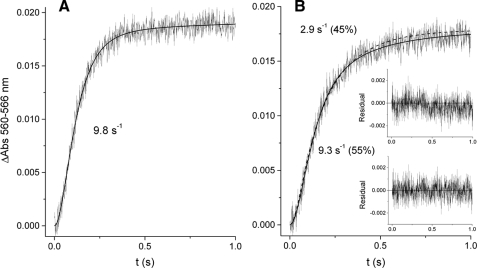
FIGURE 6.
Binding kinetics of ilicicolin to center N. The time-dependent increase in the amplitude of the blue shift generated by rapid mixing of 60 μm ilicicolin with 4 μm dithionite-reduced bc1 complex was determined after equilibrating the enzyme with myxothiazol (A) or stigmatellin (B). The best fit to either a single exponential (A) or a double exponential (B) function is shown as solid curves. A single exponential function in B (dashed curve) resulted in a worse fit as determined by comparing the residual plots (inset) resulting from the single (top) and double (bottom) exponential fits. Numbers in parentheses in B indicate the relative absorbance change attributable to each kinetic phase obtained from the double exponential fitting.

