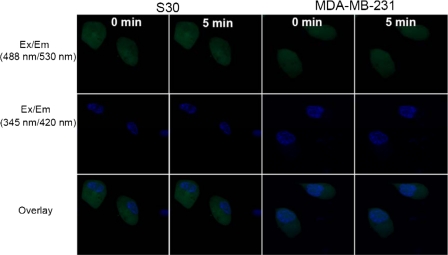
FIGURE 7.
Detection of ROS in S30 and MDA-MB-231 cells using CM-H2DCFDA. Cells were labeled with CM-H2DCFDA and treated with E2 (1 μm). Confocal images were taken before and after a 5-min treatment with each compound or vehicle control. Similar data (not shown) were obtained with E2 (10 nm). Ex/Em (488 nm/530 nm), describes the fluorescent CM-DCF excitation/emission signal; Ex/Em (345 nm/420 nm), describes the excitation and emission wavelengths of the nuclear staining signal; Overlay, describes both the CM-DCF and nuclear signals. The images shown are representative of at least three independent experiments.

