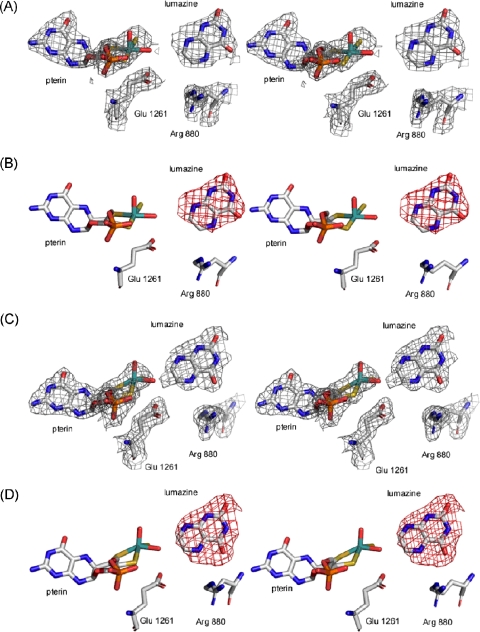
FIGURE 3.
Stereo images of the active sites of xanthine oxidase with lumazine. Shown are the 2Fo-Fc (panels A and C) and Fo-Fc (panels B and D) maps following omission of the xanthine molecules. 2Fo-Fc maps were contoured at 1.0 σ, and Fo-Fc maps at 3.0 σ. Omit maps were overlaid with the final model (Protein Data Bank code 3ETR). The active site depicted in A and B was the less occupied of the two active sites in the asymmetric unit, and in C and D the more highly occupied (see text). The molybdenum atom is in teal, sulfurs are in yellow, oxygens are in red, and nitrogens are in blue.

