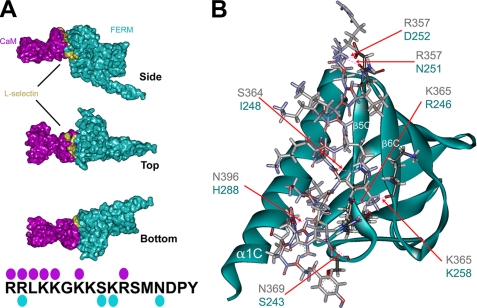
FIGURE 2.
Molecular modeling of the moesin FERM/l-selectin/CaM heterotrimeric complex. The respective crystal and NMR structures of the moesin FERM domain (cyan) and calmodulin (purple) were used to model interactions with the cytoplasmic tail of L-selectin (gold, see “Materials and Methods” for full explanation of the procedure). A, images were rendered using POV-ray software to show molecular surface (hydrogen atoms were removed prior to rendering of the image). Top, side, and bottom views of the heterotrimeric complex reveal that one side of the L-selectin tail is partly exposed. The model also reveals that interactions between CaM and the moesin FERM domain contribute substantially to the heterotrimeric complex. The cytoplasmic tail of L-selectin is marked with cyan and purple spots, which indicate the residues within the L-selectin tail that hydrogen-bond with moesin FERM and CaM, respectively (see supplemental Fig. S2 and supplemental pdb file for more detail). B, stereo view of the predicted L-selectin tail-moesin FERM interaction. Positions of the α1C, α5C, and α6C are indicated in white lettering. The contacting residues in the moesin FERM domain are very similar to those previously described for CD43, P-selectin glycoprotein ligand-1, and ICAM-2 (see Refs. 18-20). Predicted H-bonds between the L-selectin tail and moesin FERM are marked by red dashed lines, which are indicated by the red arrows. Blue and black lettering indicate the amino acid residues involved in forming putative H-bonds between moesin FERM and L-selectin, respectively.

