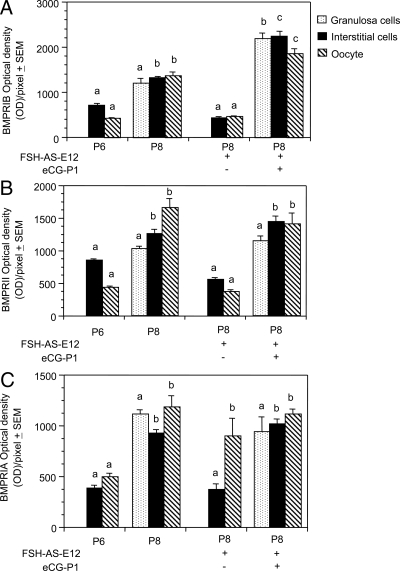
Figure 8.
Quantification of BMPR immunofluorescence. A, BMPRIB. B, BMPRII. C, BMPRIA. For the sake of brevity, OD/pixel of each receptor before and after normal primordial follicle formation and after FSH antiserum and eCG treatments were presented. Each bar represents a mean of three ovaries ± sem. The intensities for the granulosa cells, interstitial cells, and oocytes of one group were compared with the granulosa cells, interstitial cells, and oocytes, respectively, of other groups. Bars with a different letter, P < 0.05; bars with the same letter, P > 0.05.

