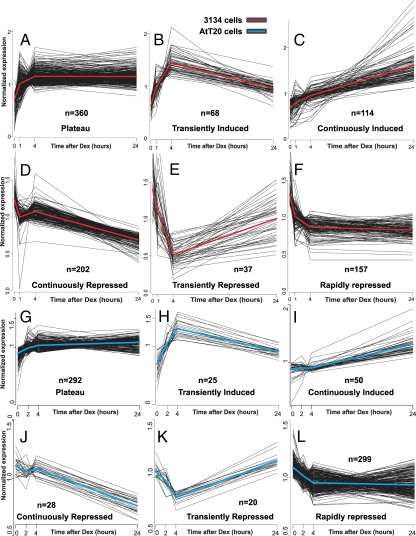
Figure 1.
Microarray profiling reveals a complex GR induction and repression profile in 3134 and AtT-20 cell lines. A–F, Mammary cells (3134) were treated with 100 nm dex for 1, 4, and 24 h. G–L, Pituitary corticotrophs (AtT-20) were treated with 100 nm dex for 0, 2, 4, and 24 h. Genes whose RNA levels are induced by dex treatment display complex induction profiles, either rapid initial induction followed by constant plateau levels (A and G) transient induction (B and H), or continuous induction (C and I). Genes whose RNA levels are repressed by dex treatment also show a time-dependent variation in the response pattern. One class of genes (D and J) is slowly and continuously repressed over the time period studied, a second class (E and K) is transiently repressed, and a third class (F and L) shows rapid and sustained repression. The plots show normalized expression levels (see Materials and Methods for a detailed description). The red or blue curves indicate the average expression within each kinetic profile for the 3134 and AtT-20 cell lines, respectively. Replicate arrays were used at each time point. Three, four, and three arrays were used for the 1, 4, and 24-h time points, respectively, for 3134. Two arrays were used for the 2-, 4-, and 24-h time points for AtT-20.

