Figure 5.
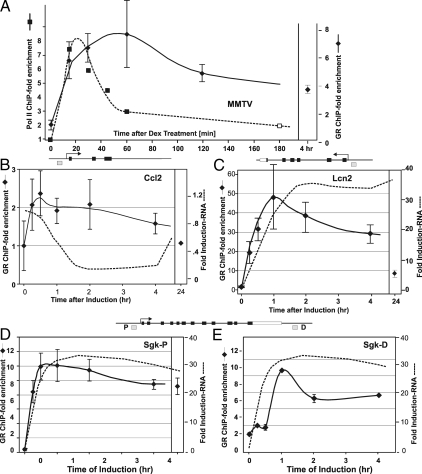
Nascent RNA analysis of GR-regulated genes and time-dependent occupancy of GR binding sites in 3134. Relative GRE occupancy at selected genes was determined by ChIP analysis and compared with levels of transcription. Values are presented as a loading ratio relative to the amount determined before hormone treatment. A, MMTV promoter: GR occupancy (-♦-) over a 4-h period of dex treatment at the nucleus. B/C GRE (31): the extent of Pol2 (-▪-) associated with MMTV reporter gene was assayed by ChIP analysis. B, Ccl2: GR binding (-♦-) at the GRE (GRE position indicated by the gray box; see diagram of the genomic structure) is shown relative to nascent RNA (—-) levels over 24 h hormone treatment. C, Lcn2: GR binding (-♦-) at the promoter proximal GRE is compared with nascent RNA (—-) levels over 24 h hormone treatment. D, Sgk-P: GR binding (-♦-) at the proximal GRE is shown relative to nascent RNA (—-) levels over 24 h hormone treatment. E, Sgk-D: GR binding (-♦-) at the distal GRE is compared with nascent RNA (—-) levels over 24 h hormone treatment. Error bars show the sd from the mean. ChIP q-PCR experiments represent at least two independent experiments (biological replicates) performed in duplicate (technical replicates).

