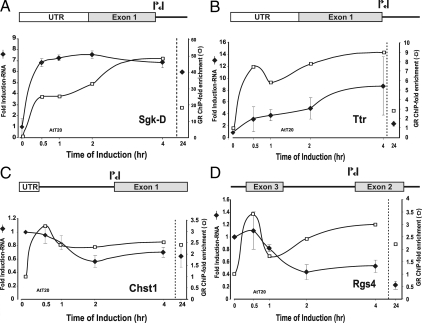
Figure 6.
Nascent RNA analysis of GR-regulated genes and time-dependent occupancy of GR binding sites in AtT-20. To evaluate more closely the transcriptional component of the complex regulatory profile, nascent transcripts were characterized for representative genes from different induction and repression classes. Nascent RNA levels were measured at multiple time points after induction by q-PCR analysis using primer pairs spanning intron/exon boundaries for each gene. Nascent transcript levels (-♦-) were determined after hormone addition for members of the rapid induction class [Sgk-D (A)], continuously induced class [Ttr (B)], rapidly repressed class [Chst1 (C), and continuously repressed class [Rgs4 (D)]. Error bars show the sd from the mean. q-PCR experiments represent three independent experiments (biological replicates) performed in duplicate (technical replicates). Relative GRE occupancy at selected genes was determined by ChIP analysis and compared with levels of transcription. Values are presented as a loading ratio relative to the amount determined before hormone treatment. A, Sgk-D: GR binding (□) at the distal GRE is shown relative to nascent RNA (-♦-) levels over 24 h hormone treatment. B, Ttr: GR binding (□) at the distal GRE is shown relative to nascent RNA (-♦-) levels over 24 h hormone treatment. C, Chst1: GR binding (□) at the distal GRE is shown relative to nascent RNA (-♦-) levels over 24 h hormone treatment. D, Rgs4: GR binding (□) at the distal GRE is shown relative to nascent RNA (-♦-) levels over 24 h hormone treatment. Error bars show the sd from the mean. ChIP q-PCR experiments represent at least two independent experiments (biological replicates) performed in duplicate (technical replicates).

