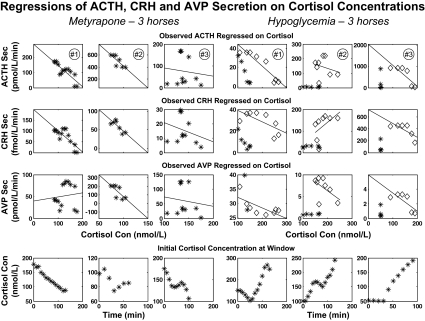
Figure 2.
Linear regression of ACTH, CRH, and AVP secretion (Sec) rates on cortisol concentrations (Con) in 40-min windows successively advanced by 10-min increments. Each data point corresponds to the 84th percentile value of the ACTH, CRH, or AVP secretion rate in a given window and the matching cortisol concentration at the start of that window (from Fig. 2). The six columns correspond to the six horses: the left three for metyrapone and the right three for hypoglycemia. Top to bottom, The upper three rows show individual window values for ACTH secretion rate vs. cortisol, CRH secretion rate vs. cortisol, and AVP secretion rate vs. cortisol. The bottom row is a plot of cortisol concentrations vs. time. For hypoglycemia, the first hour of euglycemia was excluded from least-squares linear regression (excluded time points are plotted as asterisks, the remaining points as diamonds). Estimated slopes, se values, and P values (testing that slope is negative against nonnegative) are given in Table 1.

