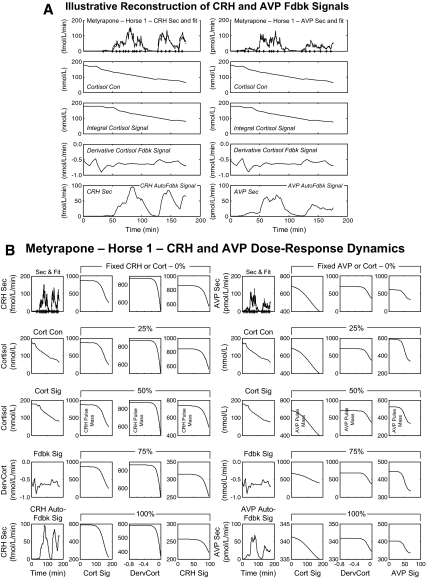
Figure 3.
A, Model-based estimates (fits) of hypothalamic CRH (left) and AVP (right) secretion (Sec), and associated feedback (Fdbk) signals (Sig) in a horse (no. 1) given metyrapone. Top row, Experimentally observed CRH and AVP secretion rates (solid lines) and estimated fits (dashed lines). The next rows depict (top to bottom): measured cortisol (Cort) concentrations (Con); estimated slow (time convolved) and rapid [time derivative (Derv)] cortisol feedback signals; and (estimated) CRH and AVP autofeedback signals. B, Secretory burst mass (y-axes) modeled as a logistical dose-response function of time-delayed (slow) and rate-dependent (fast) cortisol feedback and homologous peptide autofeedback (x-axes) in the same metyrapone-treated horse. The left four columns present CRH dose-response dynamics and the right four those for AVP. The first column of each set contains the same plots as panel A to facilitate interpretation. The second and third columns in each set represent, respectively, the effects of slow and rapid feedback by cortisol at fixed CRH or AVP levels. The fourth column in each set displays the effects of CRH or AVP autofeedback at fixed cortisol strata. The five rows in each column correspond to fixed feedback levels: 0 (lowest observed), 25, 50, 75, and 100% (maximal observed). Note different y-axis scales.

