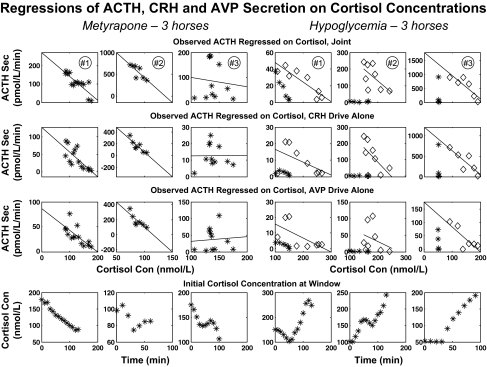
Figure 5.
Estimation of feedback by cortisol onto overall and individual drive of ACTH secretion (Sec) by CRH and AVP. Analyses are based upon logistical dose-responses surfaces constructed from 40-min time windows (illustrated in Fig. 4). For overall (joint) peptide stimulation (top row), points were calculated from successive surfaces at the 84th percentile of CRH and the 84th percentile of AVP secretion to illustrate the dynamics. Matching cortisol is from the start of each window. For CRH drive alone (second row), the 84th percentile of CRH and the zero percentile of AVP secretion were used. The converse applies for AVP action alone (third row). The six columns correspond to the six horses: left metyrapone (n = 3), right hypoglycemia (n = 3). Lines are least-squares regressions. For hypoglycemia, the first hour of englycemia was excluded from least-squares linear regression (excluded time points are plotted as asterisks, the remaining points as diamonds). Estimated slopes, se values, and P values are given in Table 2. Con, Concentration.

