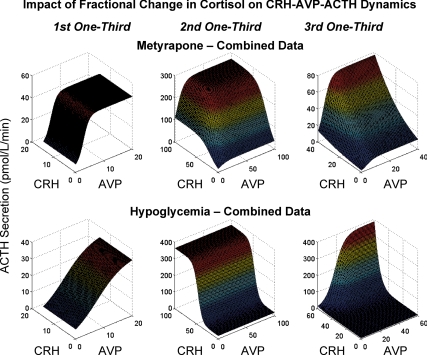
Figure 7.
Cohort-based analyses of ACTH secretion rates as logistical dose-response functions of CRH and AVP secretion. To combine data within a cohort, the total change in cortisol concentrations (maximum minimum) was calculated and divided into thirds in each horse for each intervention. Data within an intervention were then combined for analysis at each cortisol stratum. The top row displays the three (one for each one third change in cortisol) surfaces for the metyrapone study, and the bottom row those for the hypoglycemia study.

