Figure 4.
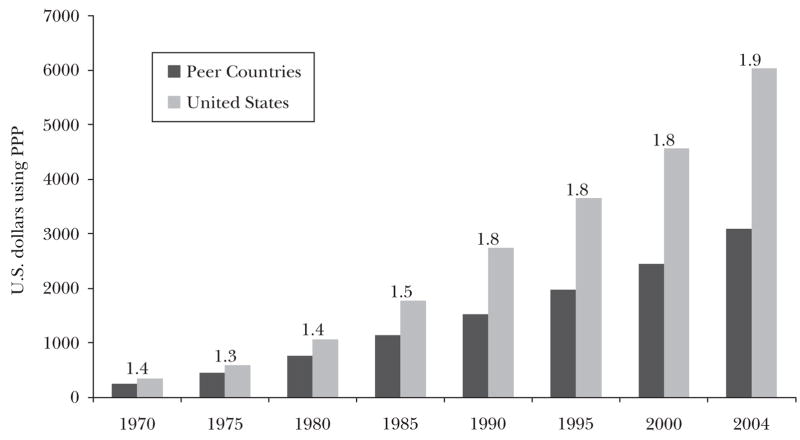
Figure 4a Per Capita Health Care Spending in the U.S. and Peer Countries: 1970–2004
Source:OCED (2008).
Note: “Peer countries” include Canada, France, Germany, Japan, Switzerland, and the United Kingdom. Ratio of U.S. to peer country spending written above bars. “PPP” is purchasing power parity.
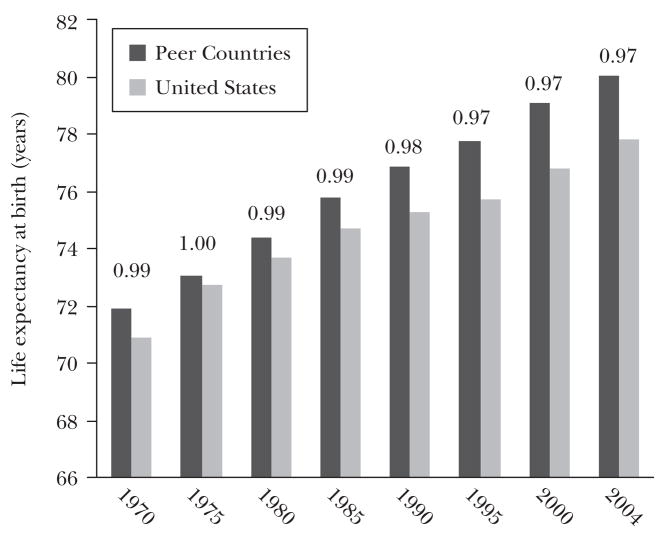
Figure 4b Relative Life Expectancy at Birth in the U.S. and Peer Countries: 1970–2004
Source: OECD (2008).
Note: “Peer countries” include Canada, France, Germany, Japan, Switzerland, and the United Kingdom. Ratio of U.S. to Peer Country life expectancy written above bars.


