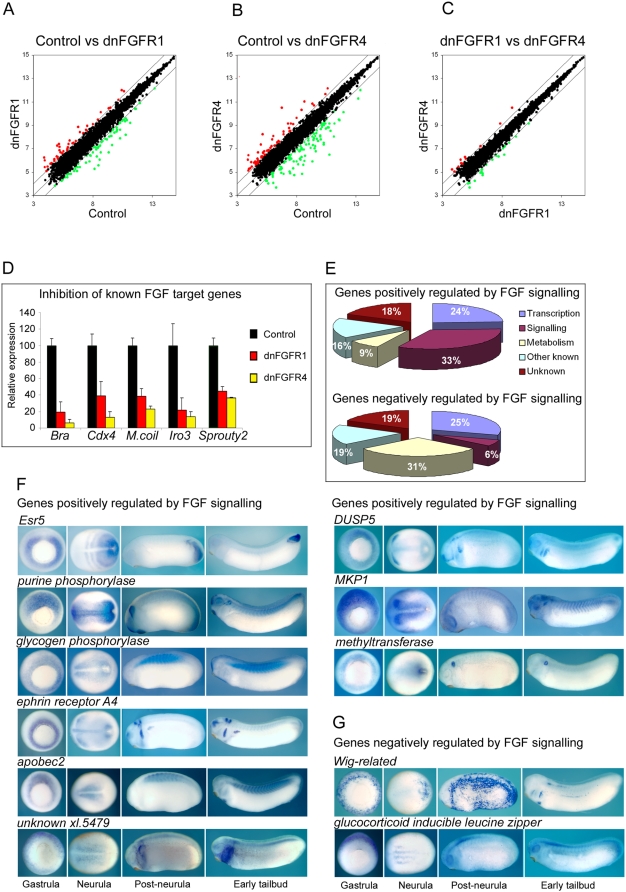
Figure 2. Identification of FGF target genes.
(A, B and C) are scatterplots of log2 probeset expression values from the Affymetrix microanalysis undertaken on early gastrula stage 10.5 control embryos, dnFGFR1 injected embryos and dnFGFR4 injected embryos . Values for each point are the average of three biological replicates. The centre line represents a ratio of 1∶1 between the two groups indicating no difference in expression. The outlying lines represent two fold differences in expression. Points representing probe sets showing ≥2 reduction in expression are indicated in green. Points representing probesets showing ≥2 increase in expression are indicated in red. (D) is a chart showing the expression of brachyury (bra), cdx4, marginal coil (M.coil), Iro3 and sprouty2 in control embryos and embryos injected with 4 ng dnFGFR1 mRNA or 4 ng dnFGFR4 mRNA. Microarray derived expression values are based on the average of three biological replicates. Relative expression is calculated as a percentage of the expression in control embryos. Standard deviation bars are indicated. (E) shows pie charts of genes positively and negatively regulated by FGF signaling. Percentages of each group classified according to their putative cellular function are indicated. Details of the up regulated and down regulated genes are contained Tables 1, 2 and Tables S2 to S11. (F) shows the expression patterns of genes positively regulated by FGF signaling at determined by in situ hybridization at early gastrula stage 10.5, early neurula stage 14, post-neurula stage 22 and early tailbud stage 30. Gastrula embryos are vegetal views with dorsal to the top. Neurula embryos are dorsal views with anterior to the left. Post-neurula and tailbud embryos are lateral view with dorsal to the top and anterior to the left. (G) shows the expression patterns of genes negatively regulated by FGF signaling.

