
Figure 2. Loss of Chk1 results in crypt death due to an increase in apoptosis.
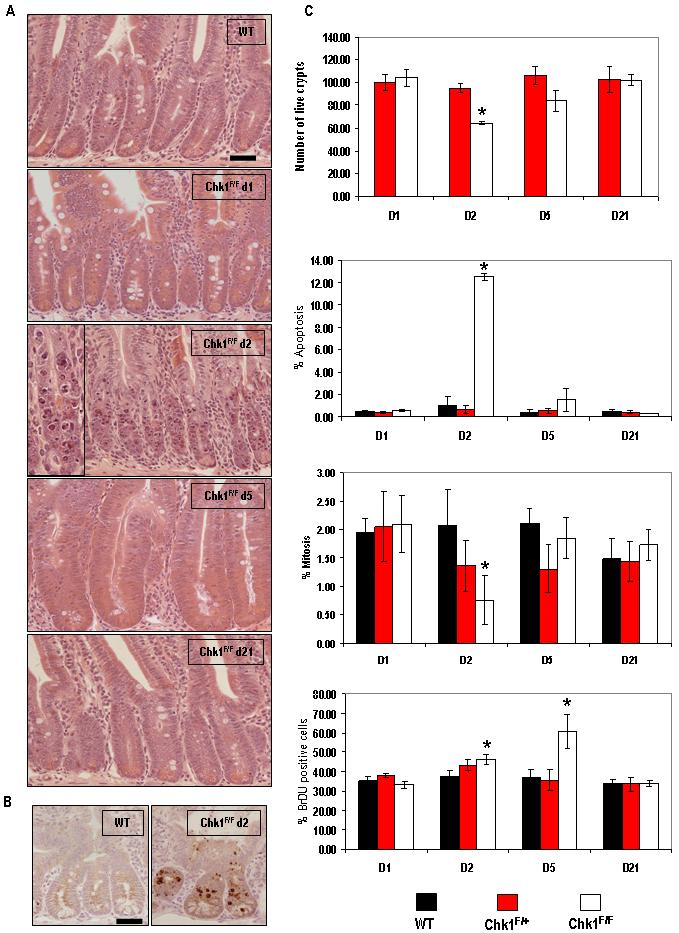
(A) H&E-stained histological sections of mouse small intestine from a wild-type mouse (AhCre+Chk1+/+) and experimental (AhCre+Chk1F/F) mice at various timepoints PI. A significant increase in apoptosis in Chk1-deficient tissue can be seen at day 2 PI (A, ChkF/F d2, see inset for magnified view) when compared to wild-type. This increase in apoptosis was independently confirmed by IHC using an antibody specific for cleaved caspase 3 (B). (C) Tissue sections were used to quantify live crypts (data shown is in terms of number of crypts scored per section and normalised to wild type controls), apoptosis and mitosis (both shown as percentage of total cells per crypt). Data shown are means ± S.D. of three independent experiments. (black bars, AhCre+Chk1+/+; red bars, AhCre+Chk1F/+ and white bars, AhCre+Chk1F/F). *, P < 0.05. To examine S-phase labelling in vivo, control (AhCre+Chk1+/+) and experimental (AhCre+Chk1F/+, AhCre+Chk1F/F) animals were injected with 100μg BrdU and culled 2hrs after labelling. BrdU incorporation was determined by IHC and quantified by scoring positively stained cells (C, bottom graph). Bar, 25μm.