
Figure 1.
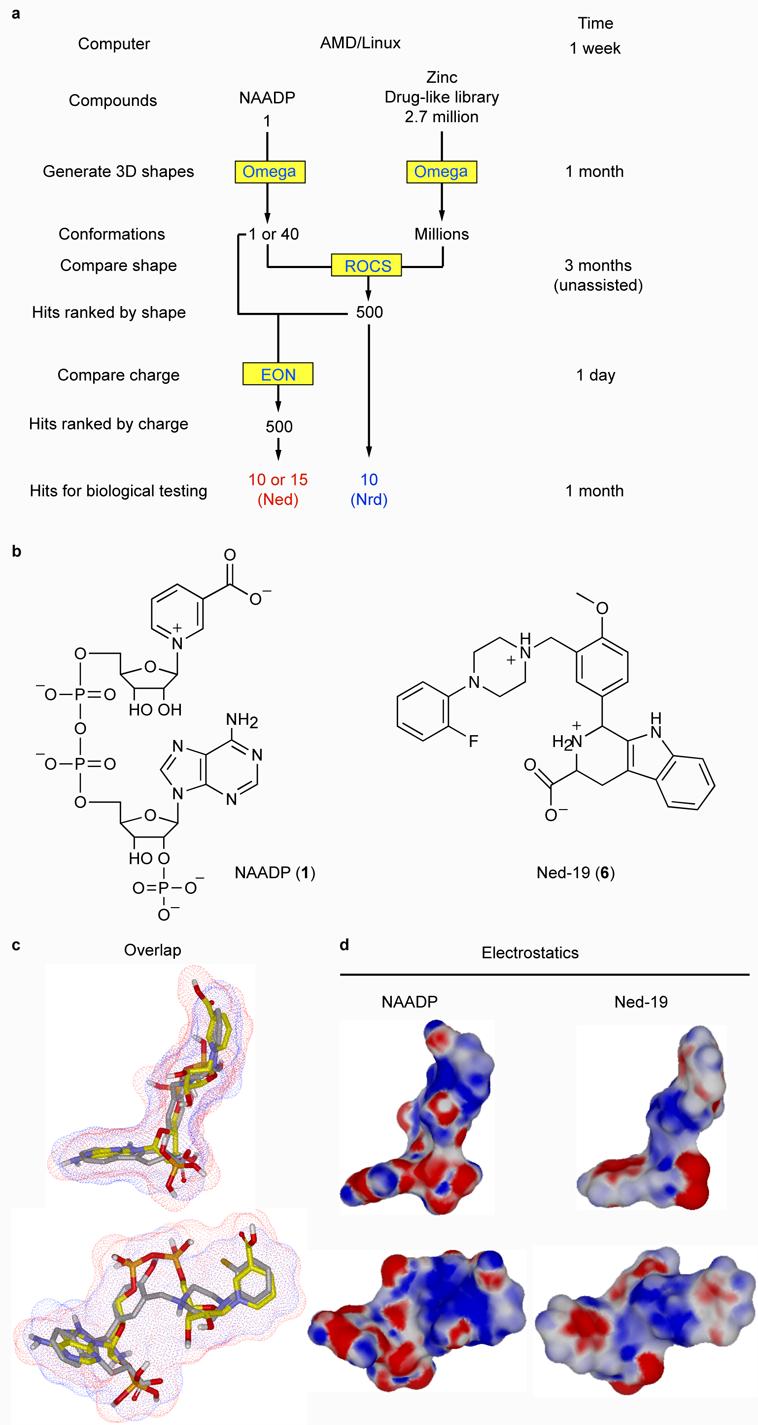
Strategy and results of a ligand-based virtual screen for drug-like molecules with NAADP-like activity. (a) Flow chart outlining the process of ligand-based virtual screening showing the steps (left column), software (yellow boxes), number of compounds and time taken (upper limits on a single computer). (b) Two-dimensional chemical structures of NAADP and Ned-19. (c) Overlay of NAADP (yellow carbons and red surface) and Ned-19 (grey carbons blue surface). (d) Three-dimensional chemical structures of NAADP and Ned-19 with electrostatic surfaces coded by color (red for negative and blue for positive).