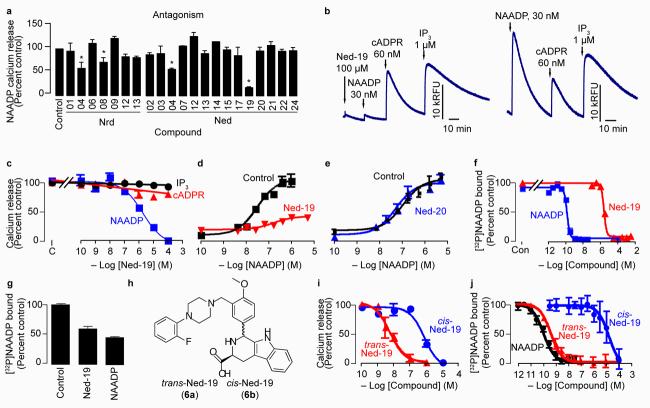
Figure 2.
Certain virtual screening hits have biological activity. (a) Relative antagonist activity of the hit compounds against NAADP-mediated Ca2+ release. Bars with an asterisk indicate inhibition significantly less than the control based on a one-tailed t-test with p ≤ 0.05. Hit compounds were present at 6-125 μM depending on their aqueous solubility (see Supplementary Methods) and NAADP was added at its EC50 (35 nM). (b) The virtual screening hit Ned-19 selectively inhibits NAADP-mediated Ca2+ release in a Ca2+-mobilizing bioassay (sea urchin egg homogenate; left panel). All three Ca2+-releasing second messengers release sequestered Ca2+ in the control when added at their half-maximal concentration (right trace). Traces show the fluorescence (Relative Fluorescence Units, RFU) from the Ca2+-reporting dye fluo-3. (c) Concentration-inhibition curves for Ned-19 on Ca2+ release mediated by the EC50 concentrations of inositol 1,4,5-trisphosphate (IP3; 1 μM), cyclic ADP-ribose (cADPR; 300 nM) and NAADP (35 nM). (d,e) Concentration-inhibition curves for the compounds Ned-19 (100 μM) (d) and Ned-20 (100 μM) (e) on NAADP-mediated Ca2+ release. (f) The compound Ned-19 competes with [32P]NAADP binding. “Con” is the amount of binding in the control. (g) Dissociation of Ned-19 (10 μM) and NAADP (10 nM) determined by the recovery of [32P]NAADP binding after 5 days of incubation. A value of 100 percent corresponds to about 1,500 counts per min. (h) Chemical structures of the ‘trans’ and ‘cis’ diastereomers of Ned-19. (i) Concentration-inhibition curves for Ned-19 inhibition of NAADP-medicated Ca2+ release. (j) Concentration-inhibition curves for Ned-19 on [32P]NAADP binding.

