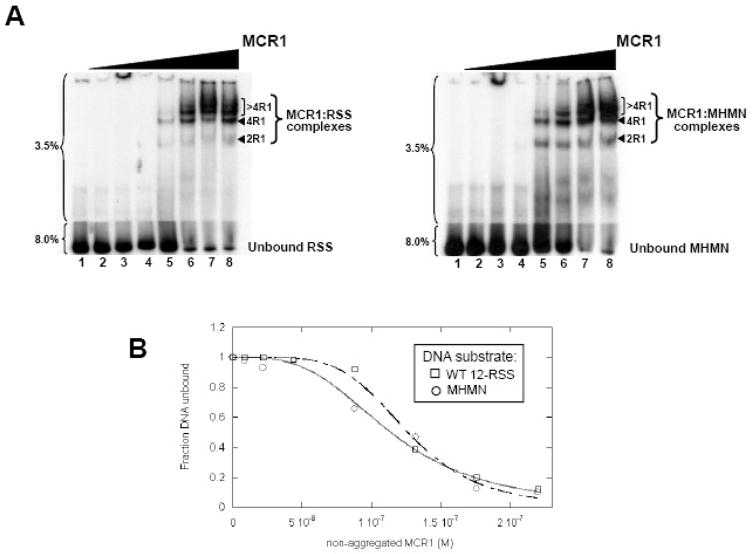
Figure 1. MCR1 titration to WT 12-RSS versus MHMN as monitored by EMSA.
(A) EMSA of radiolabeled WT-12RSS (left panel) and MHMN (right panel) titrated with MCR1. The radiolabeled DNA substrates were titrated with increasing concentrations of MCR1 (lanes 2–8 in each panel contained 8.8, 22, 44, 88, 132, 175, and 220 nM MCR1, respectively). The binding buffer contained 0.1 M NaCl. Subsequent to a 30 min incubation at room temperature, the reactions were subjected to electrophoresis on a two-part 3.5/8.0% polyacrylamide gel. The percentage of polyacrylamide is labeled to the left of each gel. The MCR1:RSS complexes are labeled according to the stoichiometry of MCR1 bound to a single RSS duplex. For example, 2R1 and 4R1 consist of 2 subunits (or a dimer) and 4 subunits, respectively, of MCR1 bound to the RSS duplex.14,26–28 Complexes containing greater than 4 bound MCR1 subunits per RSS duplex are labeled >4R1. (B) Representative plots of the fraction of unbound WT 12-RSS (open squares) and unbound MHMN (open circles) with increasing MCR1 concentrations. Binding curves of MCR1 with WT 12-RSS (dashed line) and MHMN (solid line) were fit to equation 4 to obtain Kd values (Kdapp) and Hill coefficient values (n). From three independent experiments, Kdapp = 114±5 nM (n=3±1) and Kdapp = 123±7 nM (n=4±1) for the association of MCR1 with WT 12-RSS and MHMN substrate, respectively.

