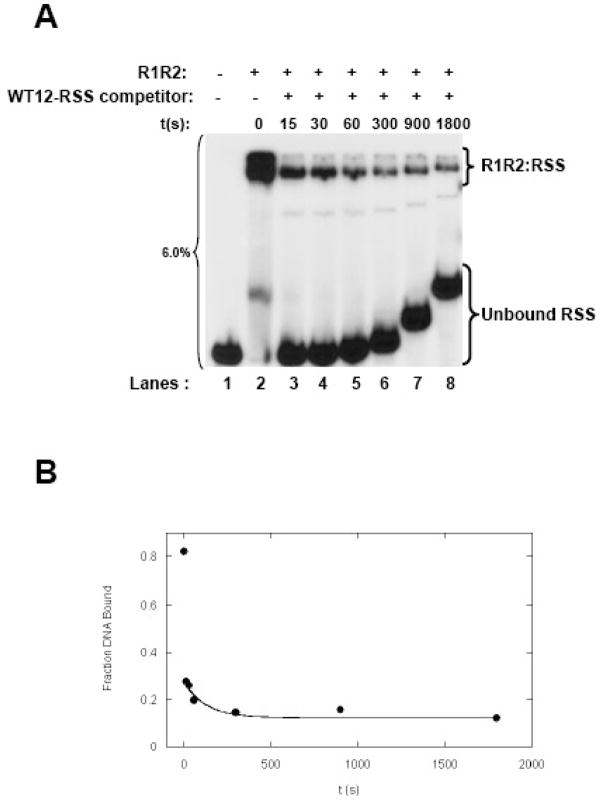
Figure 7. Kinetics of the dissociation of the R1R2:WT 12-RSS as a function of competitor DNA.
(A) Time course of the dissociation of reconstituted R1R2 complex bound to radiolabeled WT 12-RSS upon addition of a 120-fold molar excess of unlabeled WT 12-RSS competitor. At the indicated times, aliquots of the sample were loaded onto a 6% nondenaturing polyacrylamide gel. The difference in migration position of equivalent bands between lanes arises from loading of the sample aliquots sequentially on a running gel. (B) Kinetics of the dissociation of the reconstituted R1R2:WT 12-RSS complex. Representative plot of fraction DNA bound versus time was fit using data from Panel A as described in Figure 4.

