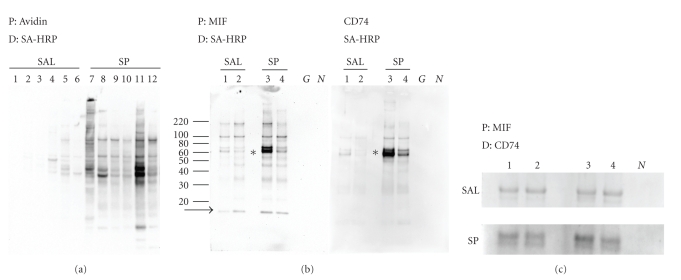
Figure 3.
Expression of CD74 and MIF on urothelial bladder surface. (a) Total biotinylated protein. Isolated urothelial cells were lysed, biotinylated proteins were isolated by avidin agarose affinity chromatography, separated by 4–12% bis tris acrylamide gels electrophoresis, transferred to PVDF and biotin containing protein bands visualized with strepavidin-HRP only, no antibodies were used. P: indicates precipitation of proteins with avidin agarose, D: indicates detection with SA-HRP only, no antibodies were used. Lanes 1–6, saline-treated animals; lanes 7–12 SP-treated animals. (b) Immunoprecipitation of biotinylated CD74 or MIF. Isolated urothelial cells were lysed, 1 mg of total biotinylated proteins was isolated by avidin agarose affinity chromatography and biotinylated CD74 or MIF protein was immunoprecipitated using appropriate antibodies. Precipitates were separated by denaturing-reducing SDS PAGE and CD74 or MIF protein detected by strepavidin-HRP. P: indicates precipitation of proteins with MIF antibody (left panel) or CD74 antibody (right panel). D: indicates detection with SA-HRP only (left and right panel), no antibodies were used. Lanes 1, 2 saline-treated animals (number 4 and 5 from Figure 3(a)), lanes 3, 4 SP-treated animals (numbers 9 and 10 from Figure 3(a)). G: indicates immunoprecipitation with GAPDH antibody documents that only biotinylated proteins were immunoprecipitated, N: indicates immunoprecipitation with nonspecific goat IgG documents antibody specificity. Lines and numbers to the far left indicate the position of molecular weight markers. Asterisk indicates the location of 76 kDa band. Arrow indicates the location of 12 kDa uncomplexed MIF. (c) Coimmunoprecipitation of cell-surface MIF/CD74 complexes. Isolated urothelial cells were lysed, 1 mg total protein was used to purify biotinylated proteins by avidin agarose affinity chromatography. Biotinylated MIF proteins were precipitated with an anti-MIF antibody. Precipitates were separated by denaturing-reducing SDS PAGE and CD74 protein containing bands identified using anti-CD74 antibody followed by an antigoat-HRP. P: indicates precipitation of proteins by MIF antibody. D: indicates detection with CD74 primary antibody and antigoat HRP secondary antibody. Upper panel saline-treated animals, Lanes 1, 2, 3, 4, (numbers 1, 2, 3, and 6 from Figure 3(a)). Lower panel SP-treated animals, Lanes 1, 2, 3, 4, (numbers 7, 8, 11, and 12 from Figure 3(a)). N: indicates immunoprecipitation with nonspecific goat IgG documents antibody specificity.

