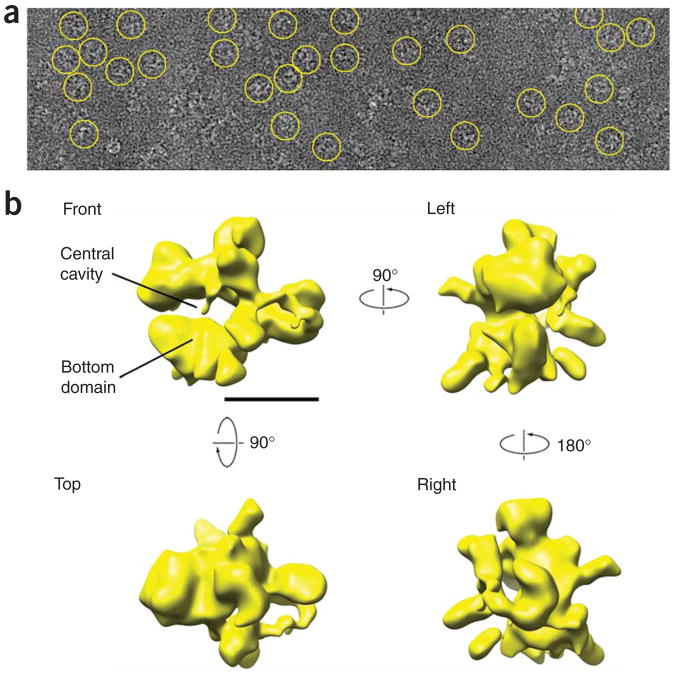
Figure 1.
Cryo-EM RSC data and reconstruction of the RSC complex. (a) Raw images of individual RSC particles preserved in a thin layer of amorphous ice. Individual RSC particles are highlighted by yellow circles. Several different views of the complex are apparent. (b) Three-dimensional structure of RSC calculated from EM images of particles preserved in amorphous ice. Four views of the RSC reconstruction are shown at a threshold value corresponding to the total mass of the complex (~1.3 MDa). The scale bar represents 100 Å.

